Search for:
Search
Skip to content
Search for:
Search
Search
Donate
Donate
About Us
Mission Statement
History
Leadership
Funding Sources
Directions to SKERI
People
Science
Centers
Labs
Projects
Publications
Library
Technical File
Fellowship Program
Overview
Background and History
Current Mentors
Current Fellows
Past Fellows
How To Apply
Careers
What’s New
News
Events
Get Involved
Why Get Involved
Giving Options
Participate in a Study
Blindness and Low Vision Support Group
Volunteers
Donate
Administration
Grants Management
Post-Award
Pre-Award
IRB
Forms
Human Subjects Training
Conflict of Interest Policy
Search for:
Search
Search
Home
/
Publications
/
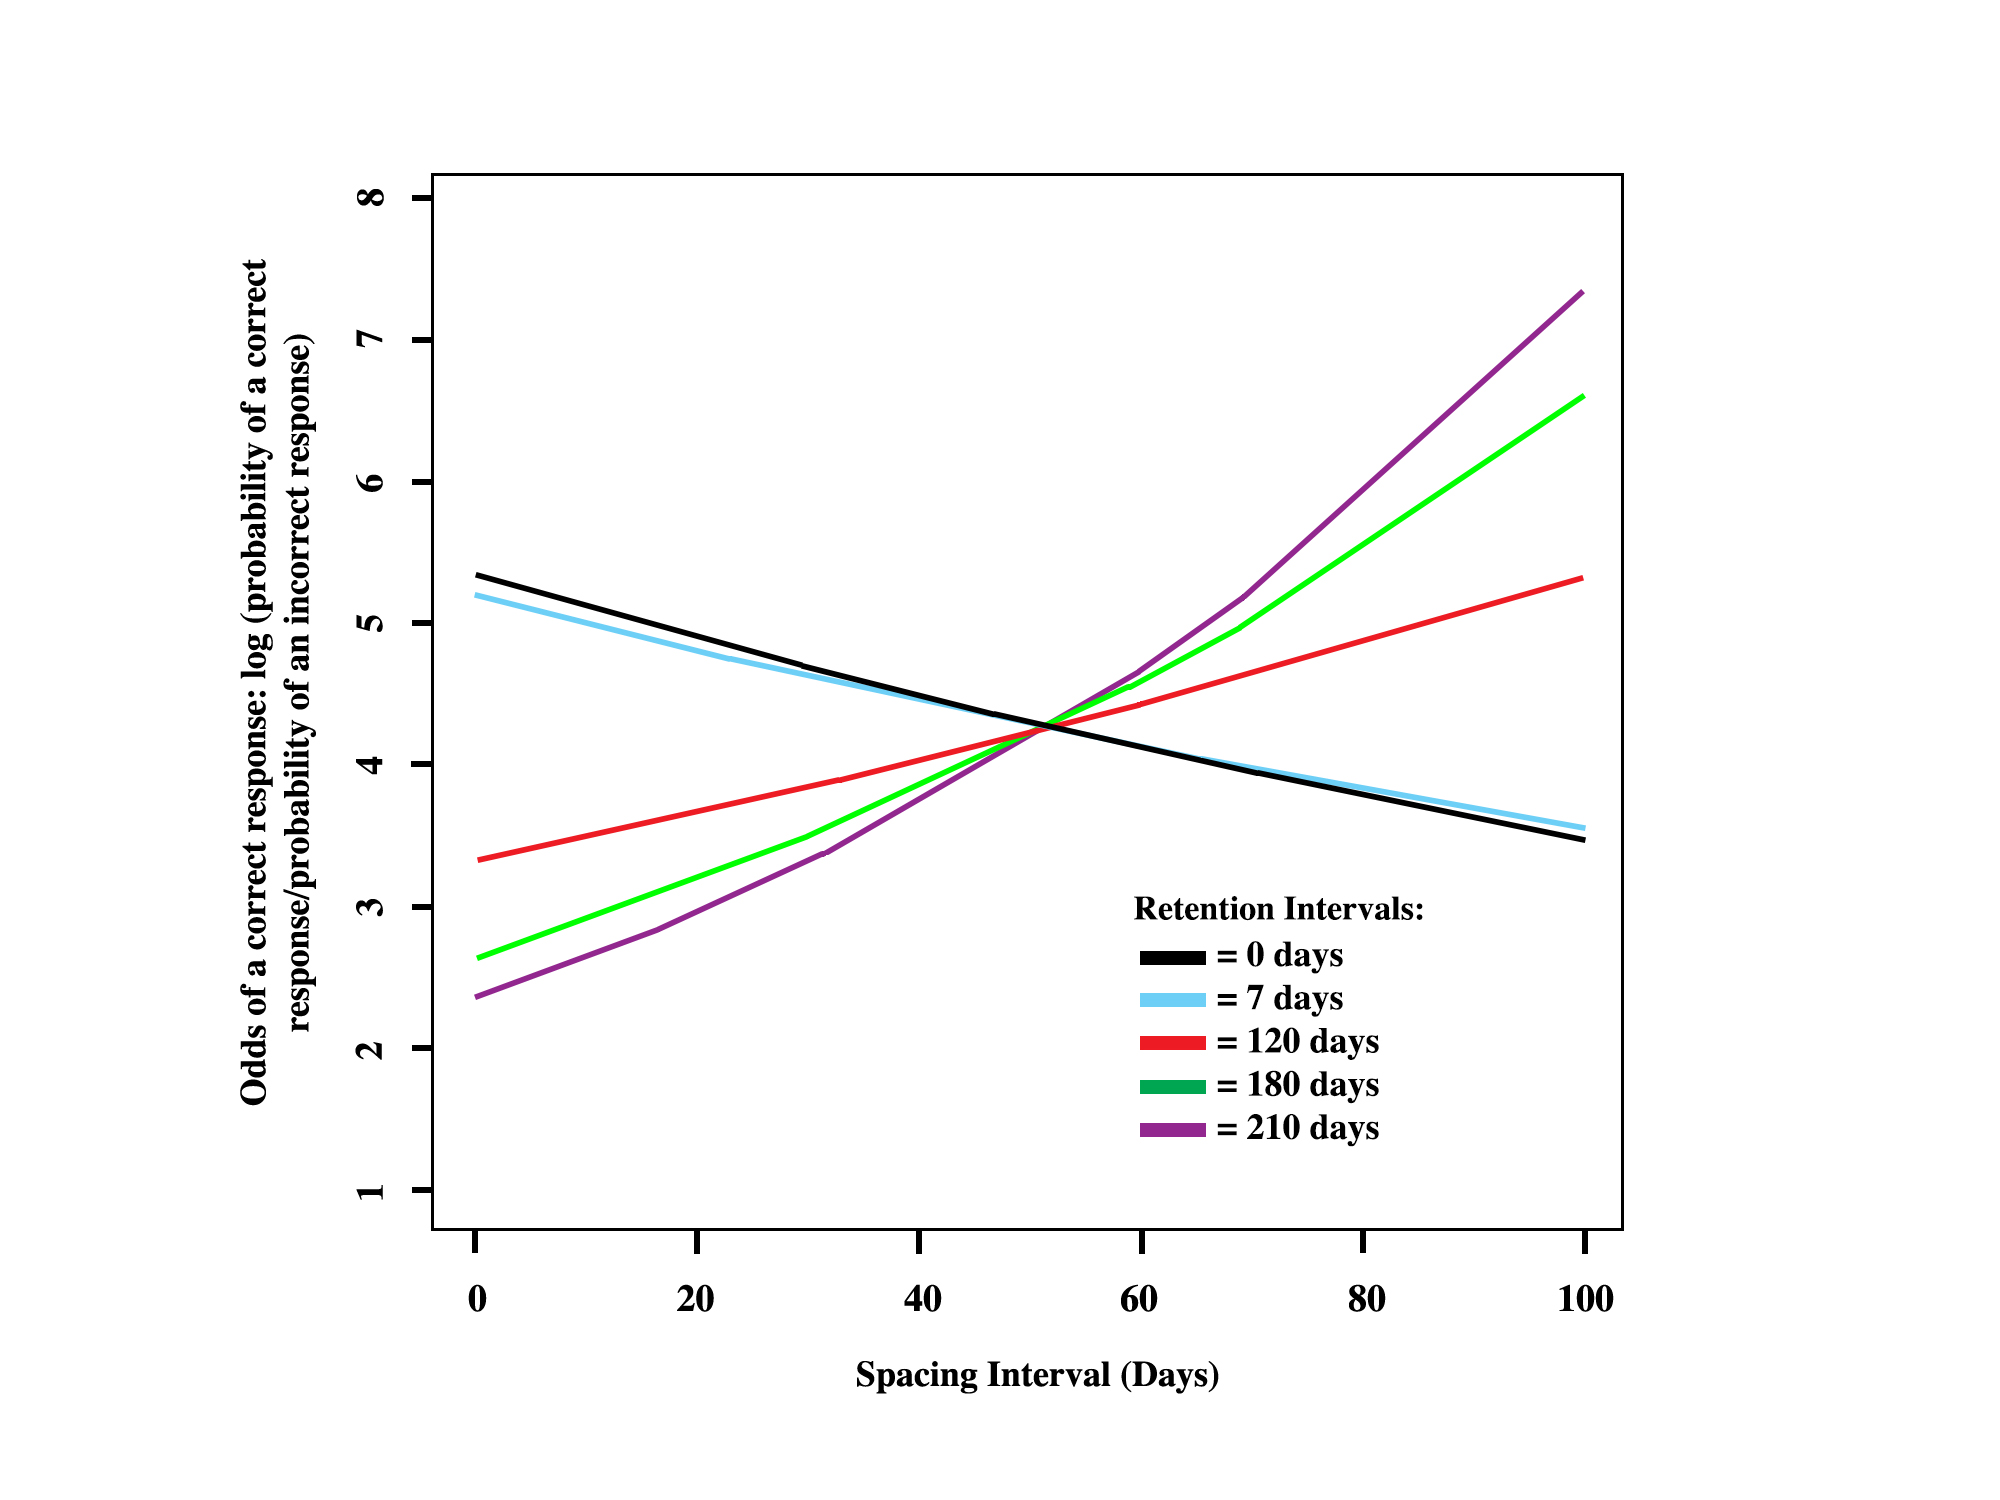
The spacing effect stands up to big data
The spacing effect stands up to big data
Publication Types
Journal Articles
Authors
A. Kim;
Audrey Wong-Kee-You;
M. Wiseheart;
R. Rosenbaum;
Journal
Behavior Research Methods
Year of publication
2019
DOI
Google Scholar